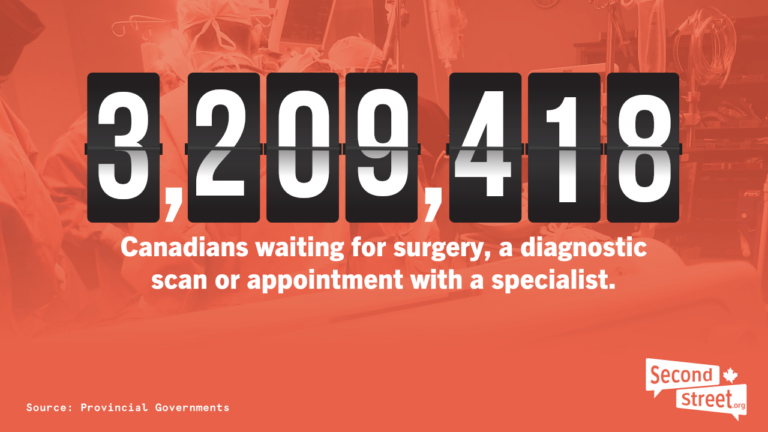
CALGARY, AB: Think tank SecondStreet.org released today data gathered from governments nation-wide that show more than 3.2 million Canadians are waiting for surgery, a diagnostic scan, or to see a specialist. However, as this data is incomplete, the true number is likely closer to 5.1 million patients – about one in eight Canadians.
Since coming out of the pandemic, SecondStreet.org has been updating CanadaWaits.ca with government waiting list figures. Since that time, the total number of Canadians waiting has appeared to drop slightly (7%) when one looks at provinces that provided data both in 2022 and for this current update.
“Despite record health spending by provincial governments to reduce wait times, improvements to waiting lists have been quite sluggish,” said Harrison Fleming, Legislative and Policy Director at SecondStreet.org. “With more than three million Canadians waiting today – nearly the same number since Canada came out of the pandemic – it’s clear that throwing money at the problem isn’t the answer. Copying policies that work well in universal systems in Europe could help.”
Some key findings from the data include:
- Seven provinces have no data on how many patients are waiting to see specialist. Others have outdated or incomplete data on the number of patients waiting for a diagnostic scan or surgery.
- Saskatchewan has seen some of the best results in Canada since the end of the pandemic, with a drop in both the number of patients waiting for surgery and diagnostic scans.
- British Columbia’s surgical waitlist volume has increased 10% since the end of the pandemic. For the first time, B.C. has provided diagnostic numbers, noting that 204,737 patients are on waitlists for MRIs, CT Scans, colonoscopies, and other GI endoscopies.
- Alberta saw a modest increase in surgical and diagnostic waitlists, in addition to a larger increase in patients waiting to see specialists. However, the province did note that the latest data set was from a larger pool of health providers than previously provided and cautioned against comparisons with previous years.
- Manitoba experienced a more than 16% increase in both the number of people waiting for surgery and to receive a diagnostic scan.
- Ontario witnessed a large decrease in surgical waitlist volumes but also experienced a large increase in diagnostic waitlist volumes.
- Quebec saw a large decrease in diagnostic waitlist volumes and a slight increase in surgical waitlist numbers.
- Atlantic Canadian provinces saw some improvements, however data was largely incomplete for the region. For example, Nova Scotia followed the example set by New Brunswick last year, only providing surgical numbers, previously having shared data for diagnostic and specialist exams.
- While some provinces like Saskatchewan and Manitoba should be applauded for innovative and publicly accessible waitlist data online, it should be noted both provinces only provide a limited number of data points, with neither sharing data on wait times for specialist appointments.
The complete data set from each province can be seen in the table below: (The percentage change since SecondStreet.org’s initial launch of CanadaWaits.ca in 2022 is seen in brackets next to each number.)
|
Province |
Surgery |
Specialist |
Diagnostic |
Date |
|
98,042 (+10.4%) |
– |
204,737 |
March 9, 2024 |
|
|
78,525 (+4.3%) |
228,799 (N/A) |
111,725 (+2.7%) |
March 11-13, 2024 |
|
|
27,846 (-22.6%) |
– |
18,352 (-11.0%) |
June 30, 2024 |
|
|
10,360 (+16.4%) |
– |
65,661 (+16.6%) |
June, 2024 |
|
|
185,081 (-19.3%) |
– |
608,010 (+32.1%) |
June 10-12, 2024 |
|
|
161,760 (+0.7%) |
827,858 (+4.3%) |
404,226 (-42.9%) |
February 24, 2024 |
|
|
26,646 (-2.2%) |
– |
– |
February 29, 2024 |
|
|
– |
– |
35,484 (-31.3%) |
Oct-Dec, 2023 |
|
|
17,447 (-33.5%) |
3,079 |
82,834 |
May 24, 2024 |
|
|
Prince Edward Island |
– |
– |
– |
October 12, 2023 |
|
– |
– |
– |
November 15, 2023 |
|
|
Northwest Territories |
872 |
9,989 |
443 |
Nov 30 – Jan 17, 2022-23 |
|
825 |
749 |
68 |
March 13-18, 2024 |
|
|
TOTALS: |
607,404 |
1,070,474 |
1,531,540 |
|
|
|
|
Grand Total: |
3,209,418 |
|
* Manitoba only provides data for four types of surgeries and five types of diagnostic scans, so numbers are underreported.
** The specialist data provided by Nova Scotia only counted waitlists for a few types of specialists. As such, the numbers are likely much higher. In addition, the province has not provided new diagnostic waitlist numbers since June 2022.
“It’s amazing how many health ministers in Canada don’t know how many patients are waiting for health services, particularly when it comes to appointments with specialists,” added SecondStreet.org President Colin Craig. “Tracking the nation’s enormous waiting list backlog should be a priority. We’re doing our part to track the data, but can governments really fix this problem if they don’t even care to understand it?” ”
SecondStreet.org regularly updates CanadaWaits.ca with the latest government data on waitlists. In terms of solutions, SecondStreet.org’s new documentary – Health Reform Now – examines five policies from better-performing universal systems in Europe.
Share on Facebook
Share on Twitter
You can help us continue to research and tell stories about this issue by making a donation or sharing this content with your friends. Be sure to sign up for our updates too!


